


Trustworthiness
We have a proven track record of purchasing mineral rights and working with mineral owners to achieve their goals in a sale.

Industry Knowledge
Our team is comprised of industry experts who understand the intricacies of the oil and gas business.

Efficiency
We're committed to making the selling process as efficient as possible so you can access the funds you need quickly.
23
Apr
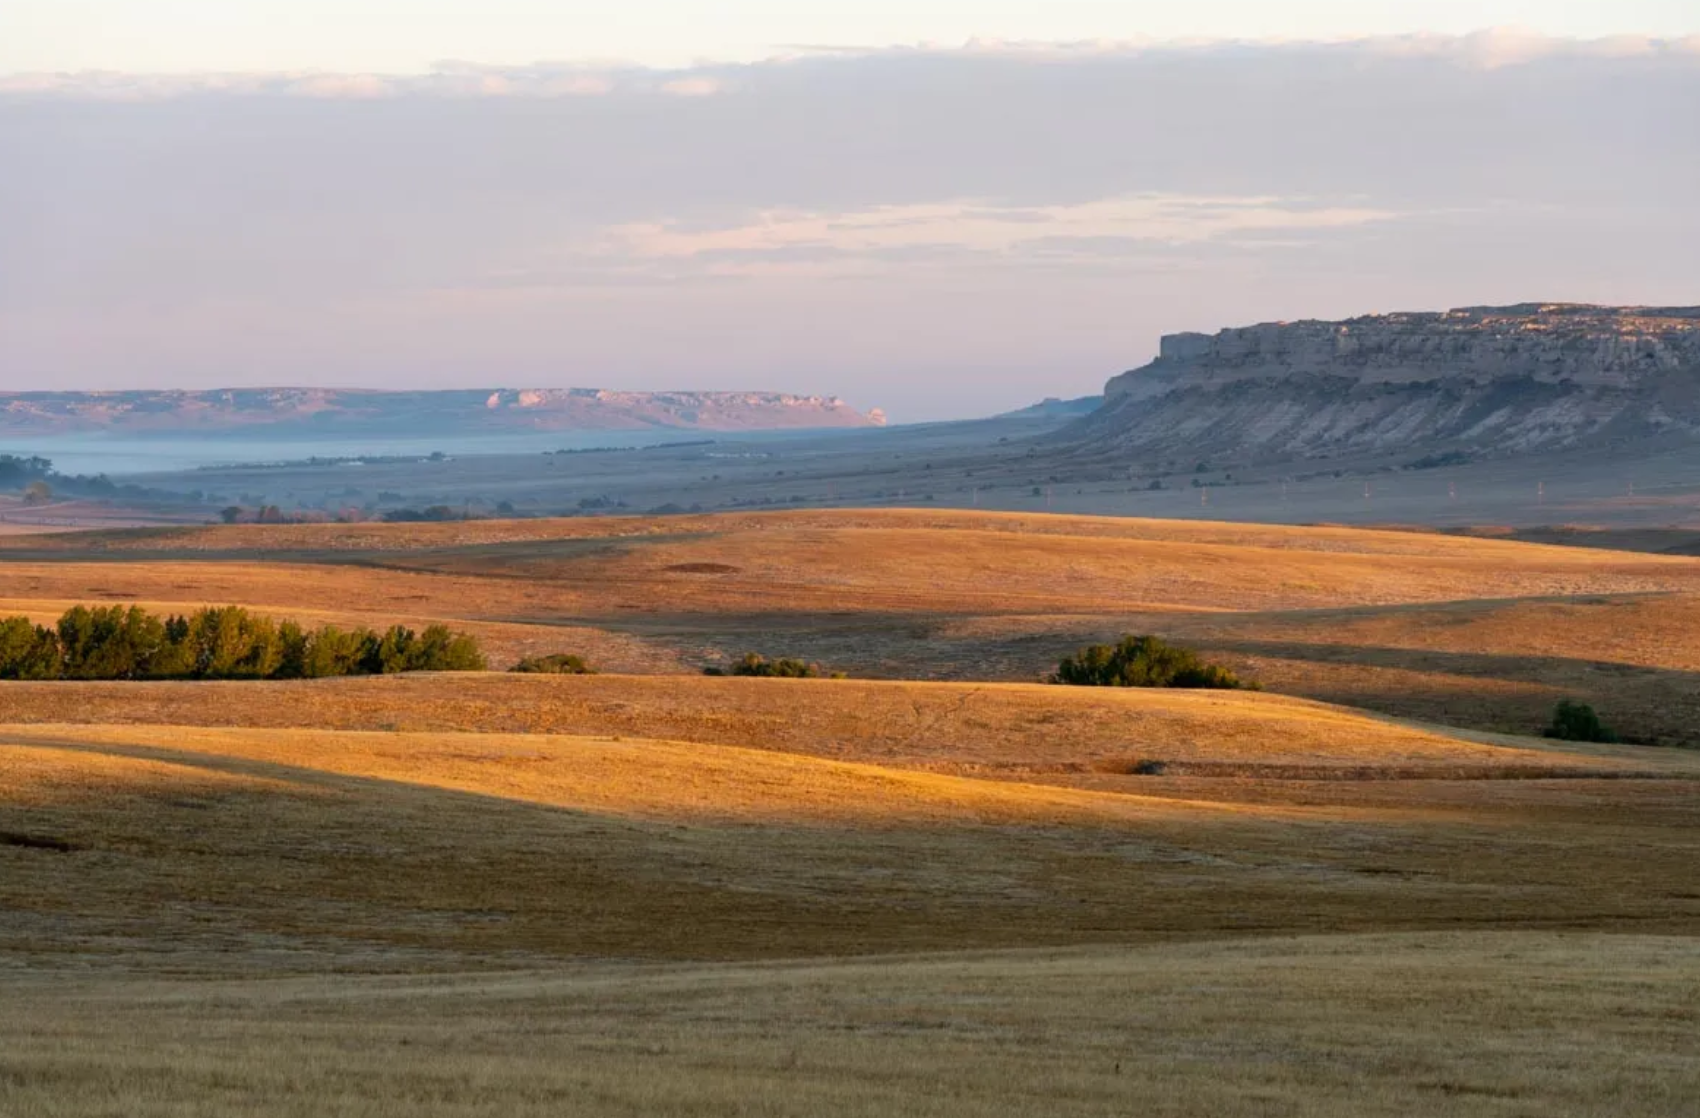
Hidden Wealth: Selling Mineral Rights in Campbell County, WY
Title: Unlocking Hidden Wealth: Selling Mineral Rights in Campbell County, WY
Opening:
Nestled in the heart of Wyoming lies Campb...
23
Apr
Unveiling Opportunity: Selling Mineral Rights in McKenzie County, ND
Unveiling Opportunity: Selling Mineral Rights in McKenzie County, ND
Are you a landowner in McKenzie County, North Dakota, w...

23
Apr
Maximizing Your Land’s Potential: Selling Mineral Rights in North Dakota to 1280 Royalties
Maximizing Your Land's Potential: Selling Mineral Rights in North Dakota to 1280 Royalties
Are you a landowner in North Dakota, curiou...
23
Apr
Unlocking Wealth: Selling Mineral Rights in Williams County, North Dakota
Are you a landowner in Williams County, North Dakota, sitting on a potential goldmine beneath your property? If so, you might be holdin...
03
Apr
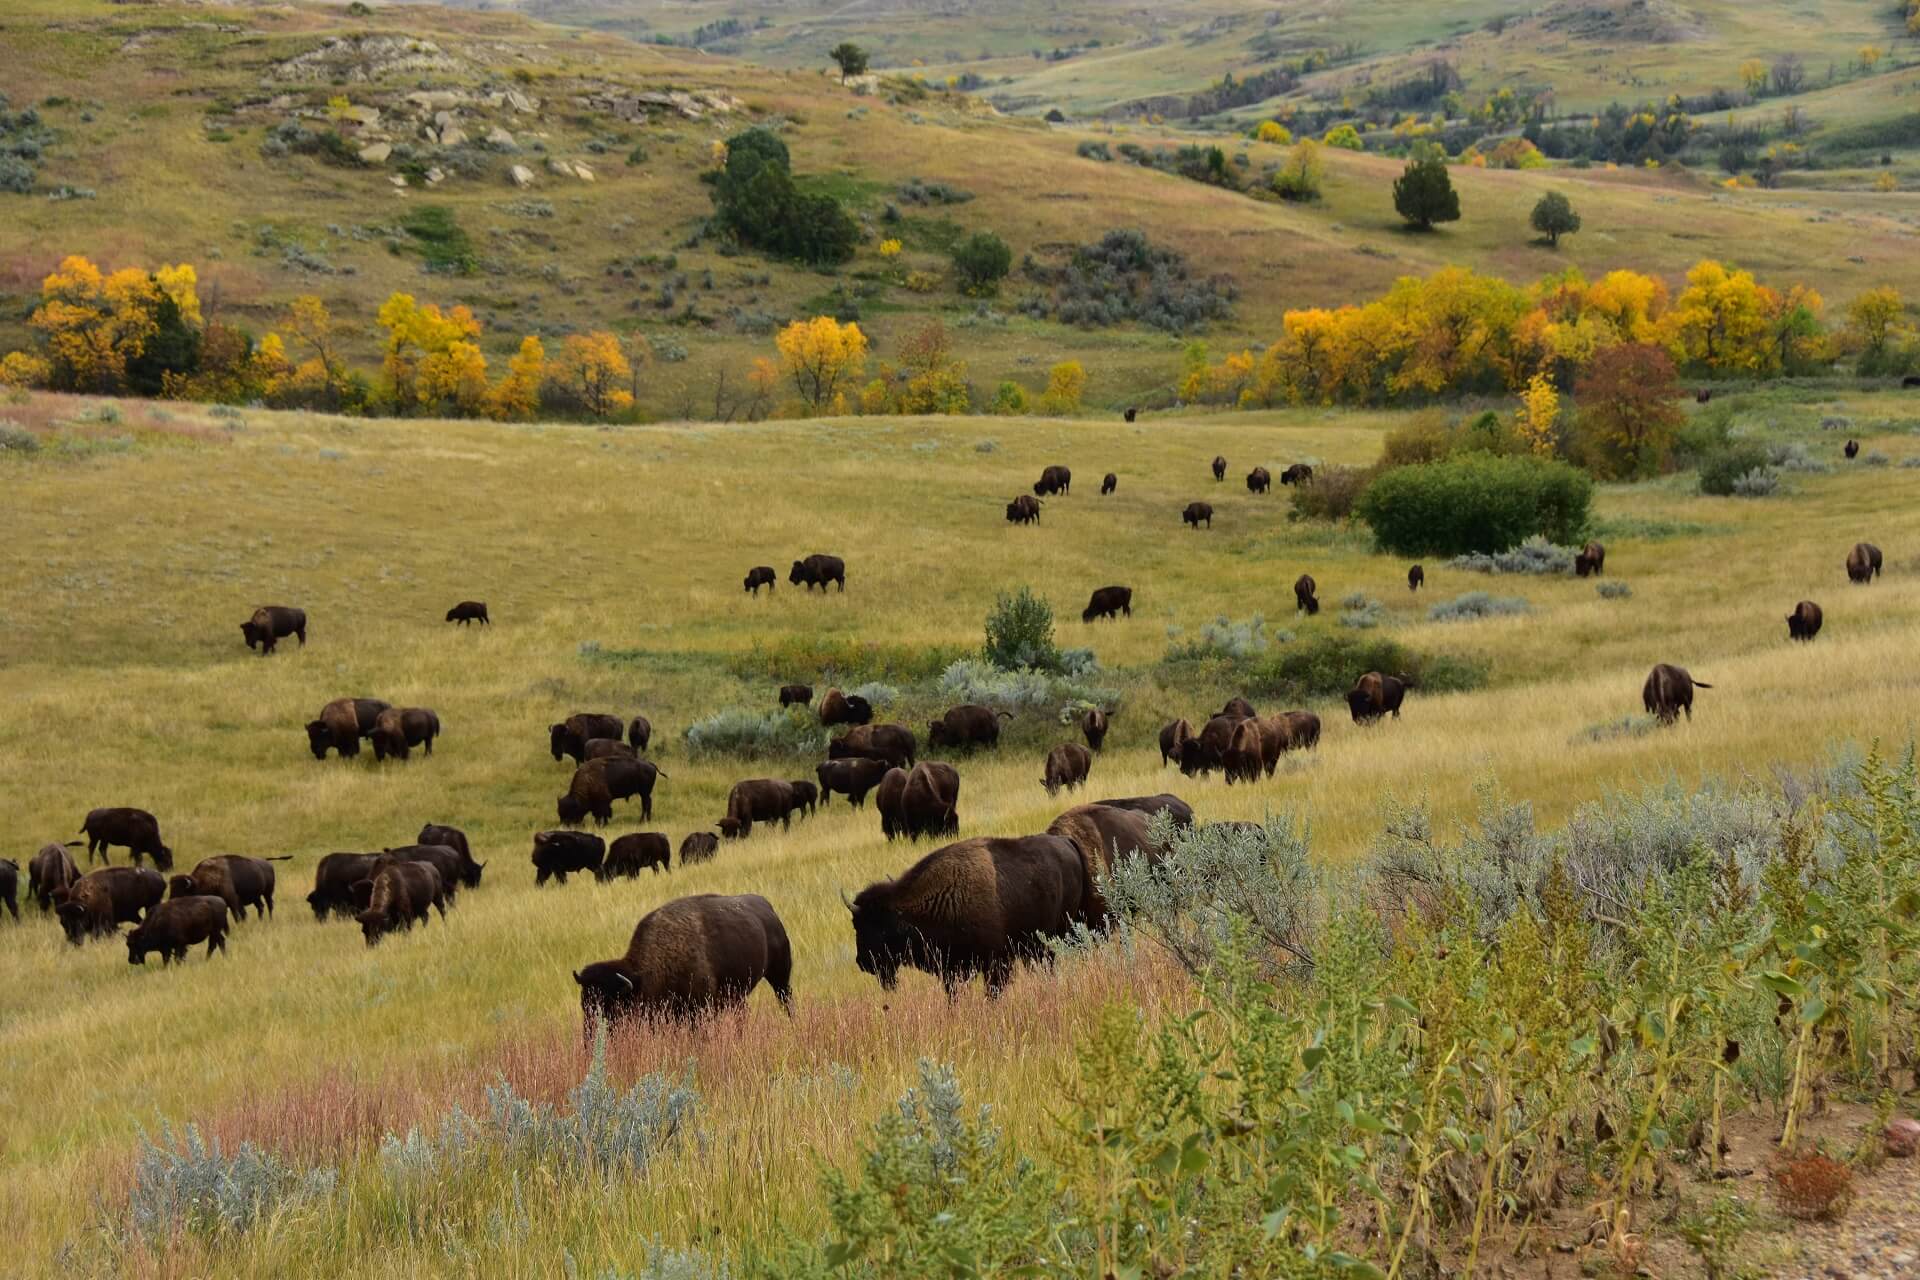
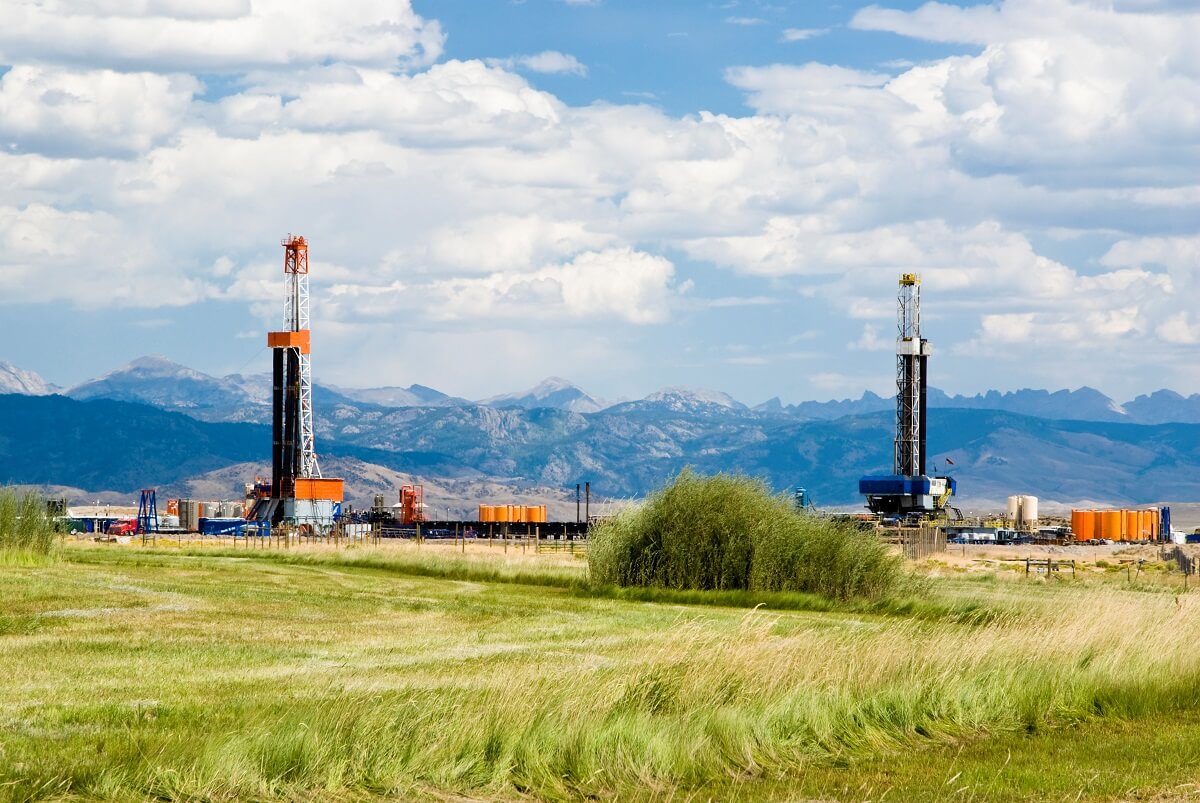
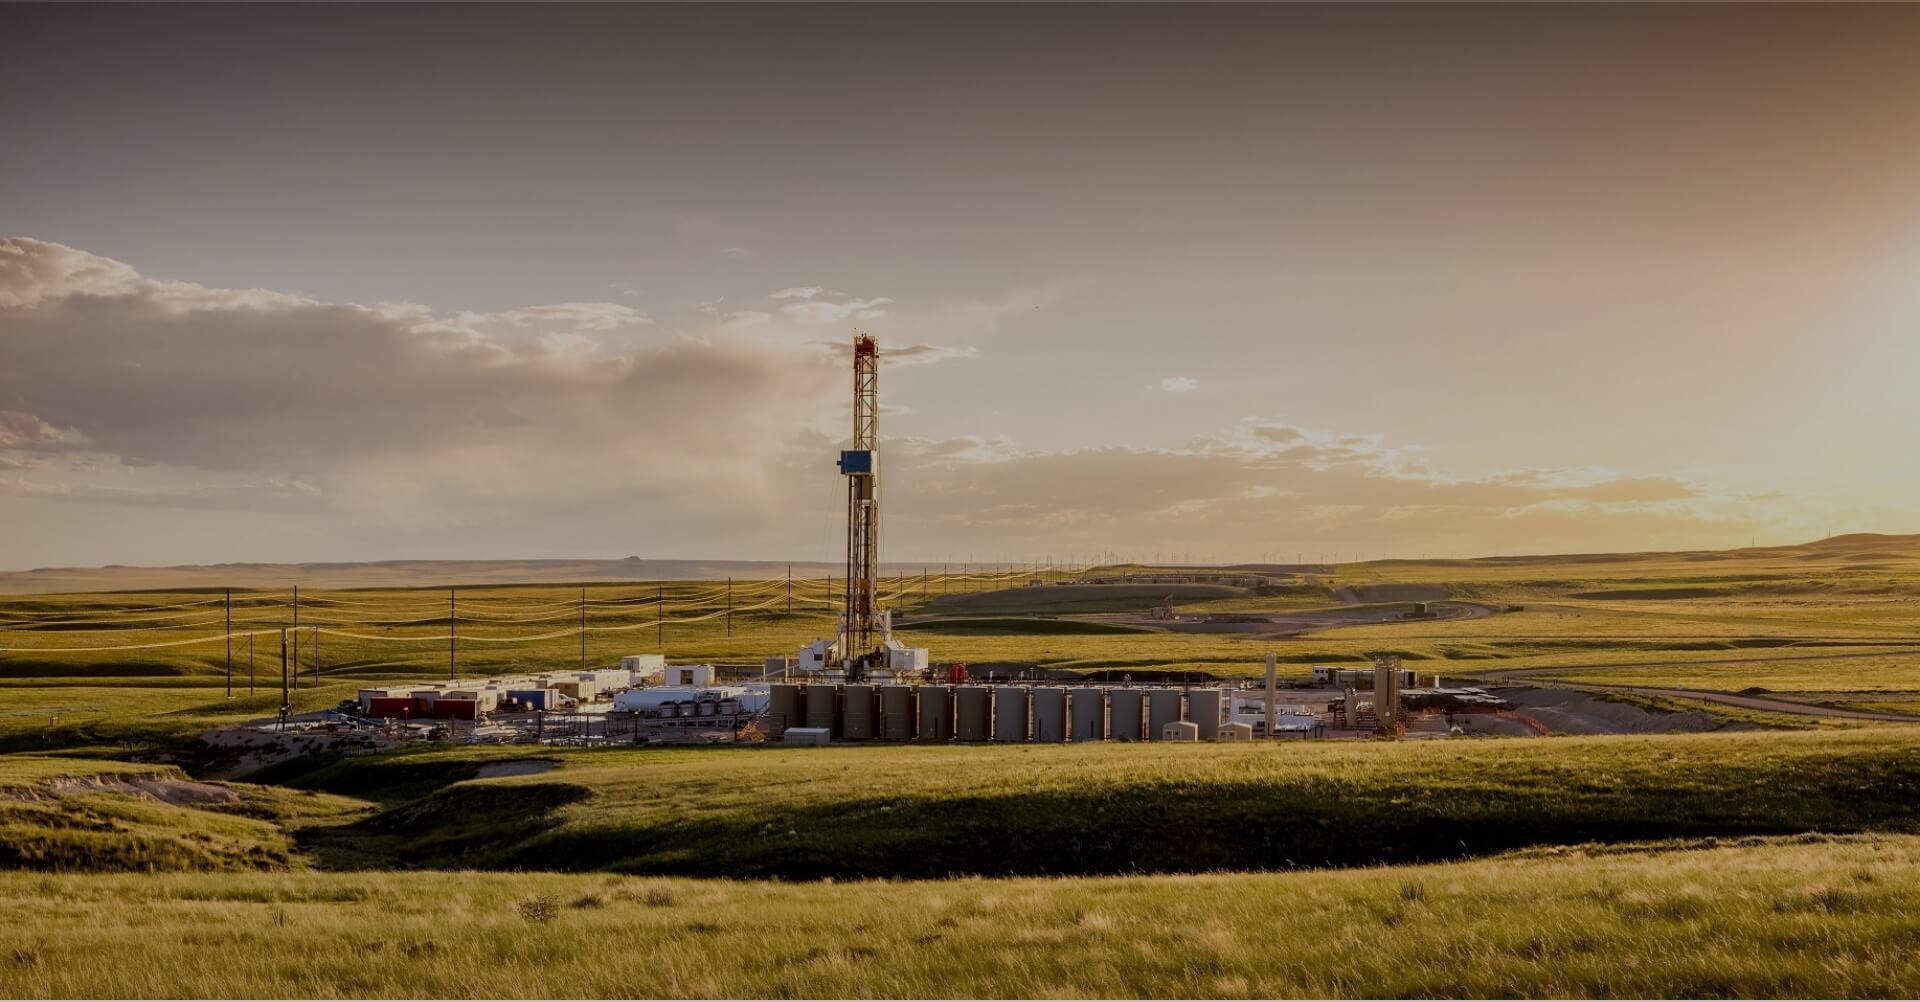
Balancing Prosperity and Preservation: Wyoming’s Oil and Gas Triumphs and Environmental Stewardship
The oil and gas industry stands as the primary economic powerhouse in Wyoming. This vital sector churns out over $5 billion in economic...
25
Mar
Should You Sell Your Mineral Rights in North Dakota? Exploring the Pros and Cons
North Dakota, known for its vast oil and gas reserves in the Bakken Formation, has been a focal point for mineral rights owners seeking...

20
Mar
Navigating Regulatory Changes: Why Selling Minerals in Colorado Makes Sense
Title: Navigating Regulatory Changes: Why Selling Minerals in Colorado Makes Sense
As the energy industry continues to evolve, navig...
20
Mar
Sell Mineral Rights in the Bakken
Title: Why Selling Your Mineral Rights in the Bakken Shale Today Makes Perfect Sense
In the ever-evolving landscape of the energy se...
15
Mar
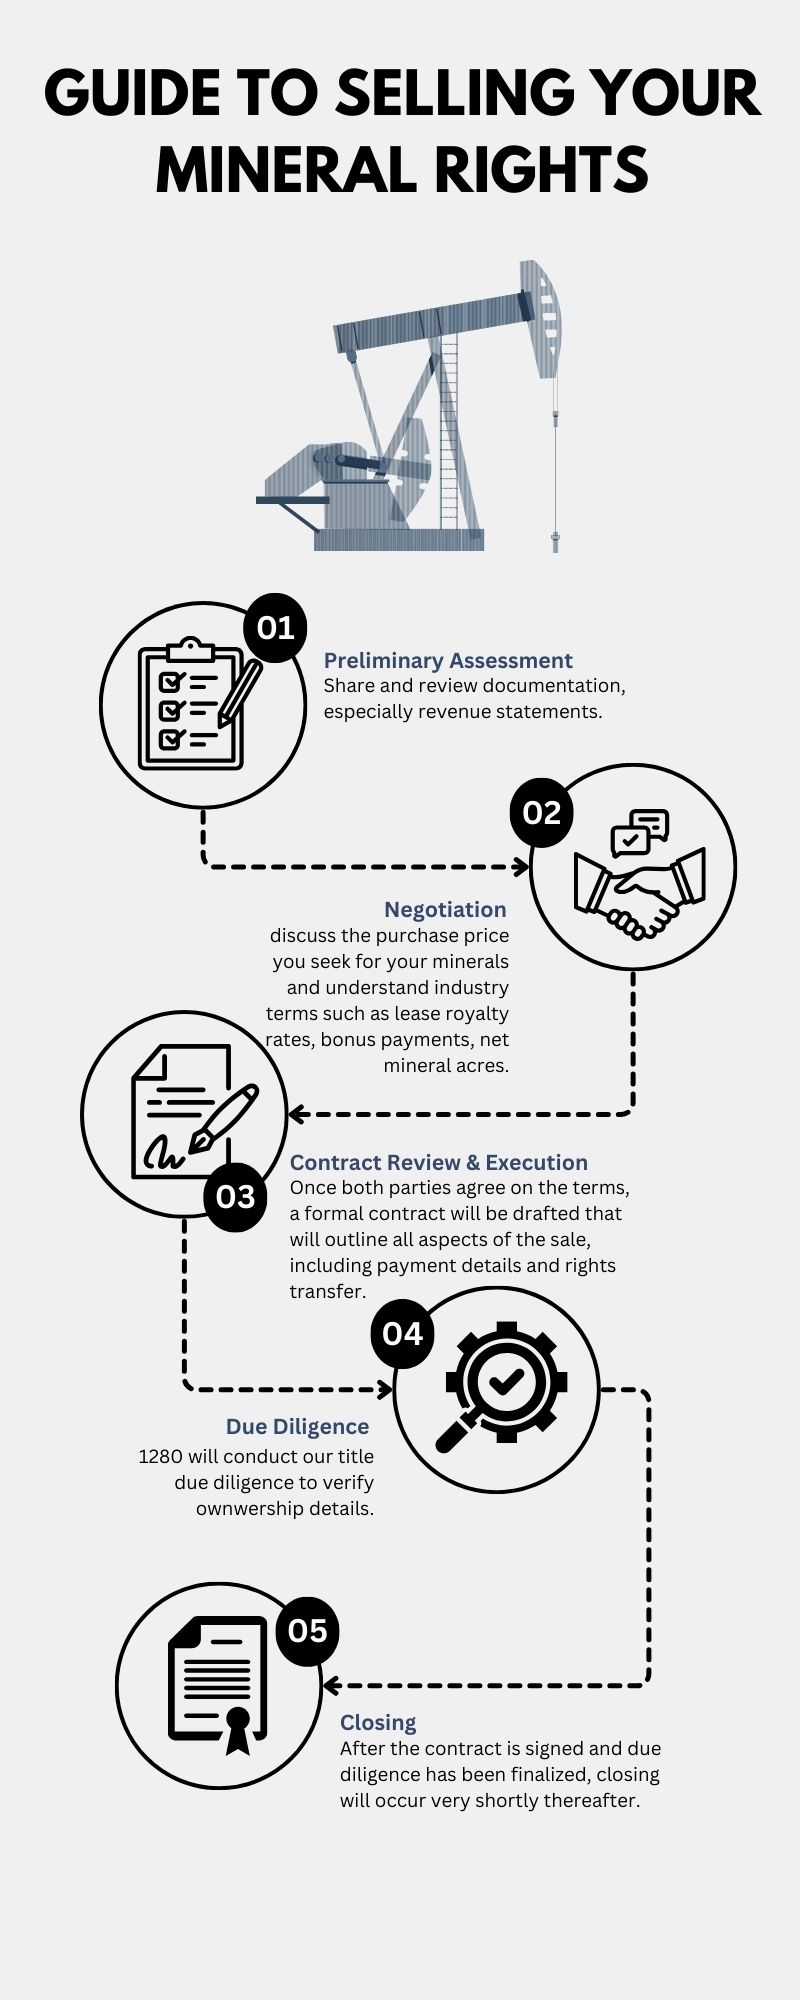
Guide to Selling Your Oil and Gas Mineral Rights with 1280 Royalties
Selling your oil and gas mineral rights might seem daunting, but fear not—we're here to simplify the process and offer our expertise ev...
13
Mar
Mineral Rigths in Wyoming – Sell Now
Deciding Whether to Sell Your Mineral Rights in Wyoming: A Comprehensive Guide
Introduction: Deciding whether to sell your mineral r...
12
Mar
What’s The Value Of My Mineral Rights in North Dakota?
Determining the value of mineral rights in North Dakota, or any other location, is a complex process that depends on various factors. S...
08
Mar
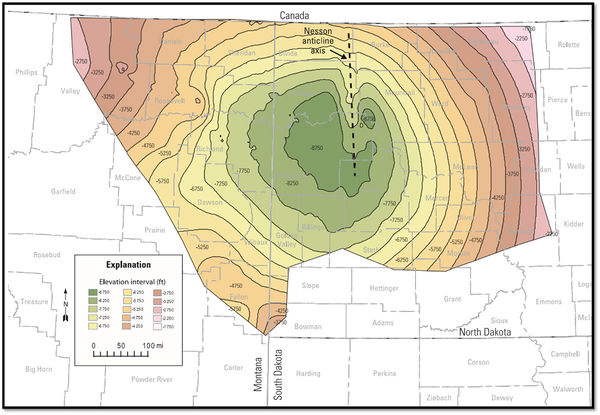
Unveiling the Bakken Shale: A Geological Marvel
The Williston Basin stands out as one of the most structurally straightforward basins globally, renowned for hosting the Bakken Shale, ...
Allan W.
Snohomish, WA
The process of our sale flowed seamlessly and quickly. My point of contact, Mallory Quay, was professional and most efficient with communication and process. She's very knowledgeable and customer oriented. my experience with 1280 Royalties is the best I've had with a mineral acquisition company.
Camille H.
Gardnerville, NV
Mallory was great about getting back to me about any questions that I had and was very personable, and was the reason I chose 1280 Royalties.
Stephen B.
Whittier, CA
I would like to thank Mallory for being so kind and polite. She made the process easy and got everything done in days.